Using Error Bars in KaleidaGraph

Create production-quality, scientific graphs quickly, easily and affordably with KaleidaGraph!
KaleidaGraph contains the comprehensive toolset you need to get your graphing and data analysis done quickly and easily. Create your first graph in minutes using a core set of plot types familiar to every data intensive professional. Produce publication-quality output for a variety of applications. KaleidaGraph provides you with the tools you need to communicate effectively.
And since our licenses are perpetual, there is no yearly subscription fee. The only cost in the future would be to optionally buy upgrades when they become available.
Try KaleidaGraph today!
Create your own plots using our FREE 30-day trial version.
KaleidaGraph Error Bars
Error bars are a graphical representation of the variability of data and indicate the error, or uncertainty in a reported measurement. They give a general idea of how accurate a measurement is, or how far from the reported value the true (error free) value might be. Error bars often represent one standard deviation of uncertainty, the standard error, or a certain confidence interval. These bars can easily be added to graphs created in KaleidaGraph.
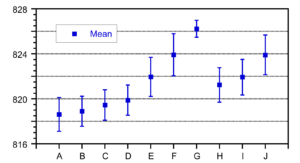
Double-sided Bars
Error bars normally appear as lines extending from the data points, with caps on either end to represent the upper and lower values of the spread. Use the same error type for both or use two different types of error for the upper and lower portions of the bar.
Single-sided Bars
Single-sided error bars are useful when you only want to display the bar on one side of the data point. You can choose a single error type and decide whether to display the positive or negative portion of the bar.

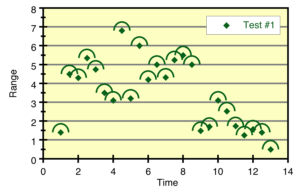
Error Arcs and Ellipses
KaleidaGraph provides the ability to display error arcs or ellipses instead of bars. An arc is displayed when only the positive or negative error is supplied. If positive and negative errors are supplied, an ellipse is displayed.
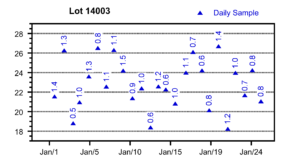
Text Error Bars
KaleidaGraph allows you to add text error bars for annotating specific markers or columns in the plot with text labels. Only data points that have errors associated with them have text labels displayed.
KaleidaGraph Graph Examples
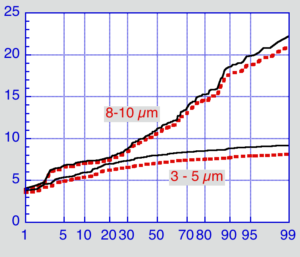
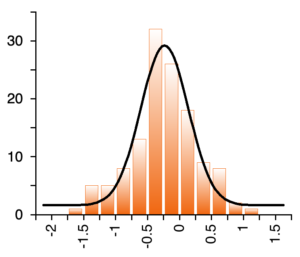
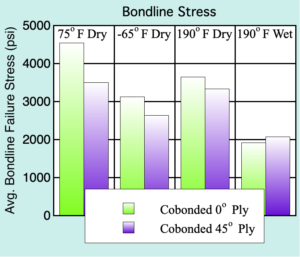
Featuring over 25 different plot types. Mac and Windows data and plot files are fully interchangeable.





Meeting the needs of scientists and engineers for over 35 years.
See what one of our long-time customers has to say:
I started using KaleidaGraph about 30 years ago, as a much welcome upgrade to the venerable Cricket Graph, which I had used on an old MacPlus since 1986 - maybe started with KaleidaGraph when I got a Mac II with color monitor, although details not so clear as it was a long time ago. Since then I have introduced it to numerous PhD, Masters, and undergrad students, so have hopefully contributed somewhat to your growth. My first intervention was always to point out, when someone presented me with a horrible Excel 'chart', that it would really be much wiser to do such things with KaleidaGraph - nobody ever told me I was wrong about this! Best wishes for the future.