Line Plot w/ Linear Curve Fit and Confidence Limits Plotted
Probability Plot w/ Linear Axis
Function Plot of a Sigmoidal Equation
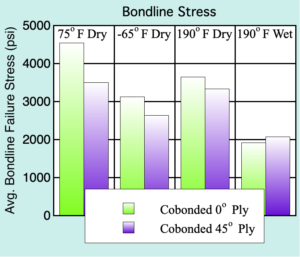
Overlaying Markers on a Summary Column Plot
Scatter Plot w/ Axis Breaks
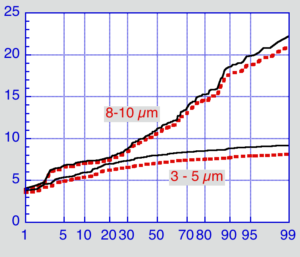
X-Y Probability Plot
Bubble Plot
Polar Plot w/ Angular Labels
Scatter Plot w/ Sigmoidal Curve Fit and Error Bars
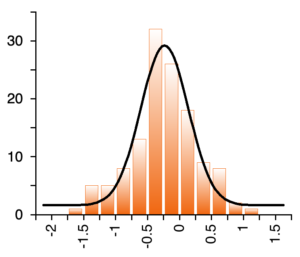
Function Plot of a Gaussian Equation
Box Plot w/ Markers
Column Plot w/ Axis Break
Exploded Pie Chart
Horizontal Bar Plot w/ Error Bars
Summary Column Plot
Function Plot
Floating Column Plot
Polar Plot
Probability Plot
Box Plot w/ Outliers
Double X Plot
Dot Plot
Column Plot w/ Curve Fit
Double Y Plot
Bubble Plot
Double Y Column Plot
Pie Chart w/ Values
Double Y Bar Plot w/ Error Bars
Function Plot
Scatter Plot w/ Interpolate Curve Fits
Floating Bar Plot
Overlaying Markers on a Box Plot
Double X Plot w/ Repositioned X2 Axis
Scatter Plot w/ Polynomial Curve Fit
Stack Column Plot
High/Low Plot
Stack Bar Plot
Histogram Plot
Step Plot
Percentile Plot
Polar Plot w/ Square Grid
Pie Chart
Overlaying Markers on a Percentile Plot
Want to have access to these plots or need tips on how they were created?
Feel free to download a ZIP file containing all of the plot files. Contact our technical support department for more information on any of these plots or if you have some interesting plots that we can showcase.