Use KaleidaGraph to Analyze Data

Create production-quality scientific graphs in minutes!
KaleidaGraph has the graphing and analysis tools you need for your next journey of discovery. With a comprehensive set of plot types, a broad range of curve fitting options, and an array of parametric and nonparametric statistical tests, KaleidaGraph allows you to explore, analyze, and truly learn from your data.
And since our licenses are perpetual, there is no yearly subscription fee. The only cost in the future would be to optionally buy upgrades when they become available.
Try KaleidaGraph today!
Create your own plots using our FREE 30-day trial version.
KaleidaGraph Data Analysis Features
KaleidaGraph is known for its graphing abilities and curve fitting, but it also performs a variety of statistical tests and functions, including:
- Calculating simple statistics on selected columns in the data window.
- Counting the number of data points that fall within a certain range.
- Performing a single sample test to compare one sample to a known value.
- Running a group comparison test to analyze two or more samples for statistically significant differences.
- Performing a repeated measures test to compare the differences in two or more matched samples.
KaleidaGraph includes all of these tests. In most cases you don’t need to buy additional software for data analysis.
Column Statistics
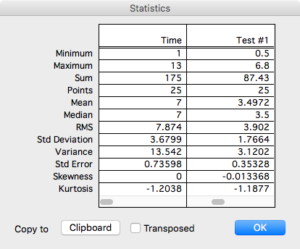
Calculate a number of different statistics for each column in the data window with the click of a button: minimum, maximum, sum, points, mean, median, RMS, std. deviation, std. error, skewness, and kurtosis.
Binning Data in KaleidaGraph
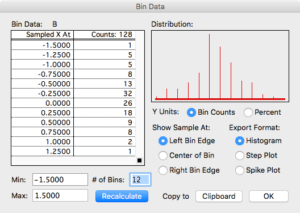
The Bin Data command counts the number of data points that fall within the specified number of bins across a given data range. Afterward, export the results to create a Histogram, Step, or Spike plot.
Choosing a Parametric Test
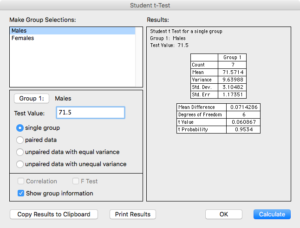
Use one of these tests for data samples drawn from a normally distributed set of data. One and two-way ANOVA (with repeated measures) and the Student t-test are examples of parametric tests found in KaleidaGraph.
Choosing a Nonparametric Test
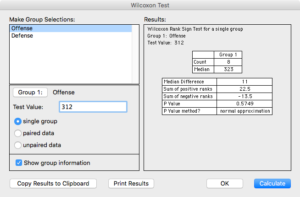
Use one of these tests if the data represents a rank or score, or if using data from a set without a normal ditribution. Wilcoxon (Signed rank, Matched pairs, Wilcoxon-Mann-Whitney), Kruskal-Wallis, and Friedman are examples of nonparametric tests found in KaleidaGraph.
Post Hoc Tests
After finding a statistically significant difference in a one-way or one-way repeated measures ANOVA, see differences in the groups using one of the following post hoc tests : Tukey HSD, Bonferroni, Holm, Student-Newman-Keuls, Scheffe, Fisher’s LSD, or Dunnett.
KaleidaGraph Graph Examples
Featuring over 25 different plot types. Mac and Windows data and plot files are fully interchangeable.

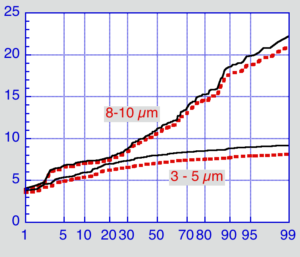


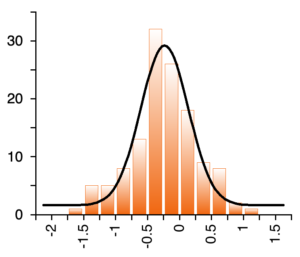


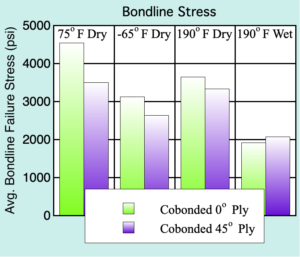
Meeting the needs of scientists and engineers for over 35 years.
See what one of our long-time customers has to say:
I started using KaleidaGraph about 30 years ago, as a much welcome upgrade to the venerable Cricket Graph, which I had used on an old MacPlus since 1986 - maybe started with KaleidaGraph when I got a Mac II with color monitor, although details not so clear as it was a long time ago. Since then I have introduced it to numerous PhD, Masters, and undergrad students, so have hopefully contributed somewhat to your growth. My first intervention was always to point out, when someone presented me with a horrible Excel 'chart', that it would really be much wiser to do such things with KaleidaGraph - nobody ever told me I was wrong about this! Best wishes for the future.