Collect Your Data. KaleidaGraph Will Handle the Rest.
Everything You Need to Turn Complex Data into Clear Insights
KaleidaGraph equips you with the essential graphing and analysis tools for your next breakthrough. Featuring a comprehensive suite of plot types, powerful curve fitting, and versatile statistical tests, KaleidaGraph gives you everything you need to thoroughly explore and understand your data.
Ownership made simple: Our perpetual licenses mean no yearly subscription fees. You pay once to own your software, with the freedom to choose optional upgrades whenever new versions launch.
Try KaleidaGraph today!
Create your own plots using our FREE 30-day trial version.
Powerful Curve Fitting. Complete Statistical Analysis.
KaleidaGraph goes far beyond advanced graphing. It delivers built-in statistical tools so you can analyze, compare, and validate your data—without purchasing extra software.
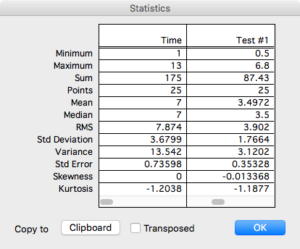
- Descriptive Statistics: Calculate summary statistics instantly on any selected data columns.
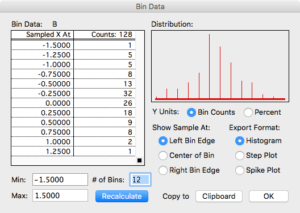
- Binning & Distribution: Count and categorize data points falling within custom ranges.
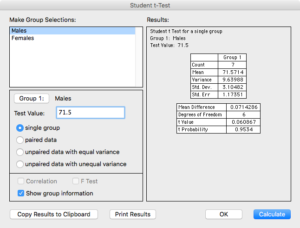
- Single-Sample Tests: Compare your sample data against known theoretical values.
- Group Comparisons: Uncover statistically significant differences between two or more groups.
- Repeated Measures: Evaluate matched samples over multiple time points or conditions.
Everything you need for data analysis, all in one place.
Instant Column Statistics
Generate a complete statistical summary for every column in one click—including mean, median, standard deviation, skewness, kurtosis, and more.
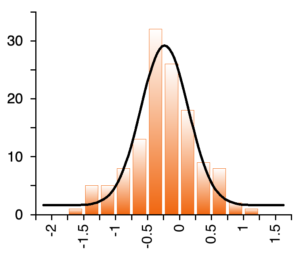
Binning Data in KaleidaGraph
Easily count and group your data points into custom bins, then instantly export the results to generate clean Histogram, Step, or Spike plots.
Choosing a Parametric Test
Analyze normally distributed data with confidence. Use KaleidaGraph to run Student’s t-tests and One- or Two-Way ANOVAs (including repeated measures) in just a few clicks.
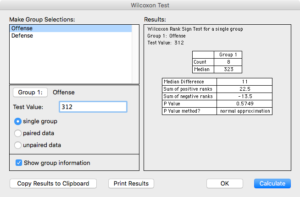
Choosing a Nonparametric Test
Use a nonparametric test if your data involves ranks, scores, or does not follow a normal distribution. Common nonparametric tests available in KaleidaGraph include: Wilcoxon (Signed Rank, Matched Pairs, Wilcoxon-Mann-Whitney), Kruskal-Wallis, and Friedman.
Pinpoint exact group differences with post hoc analysis.
Automatically follow up your one-way or repeated measures ANOVA with robust post hoc testing. Choose from Tukey HSD, Bonferroni, Holm, Scheffé, Fisher’s LSD, or Dunnett to compare individual group pairs with confidence.
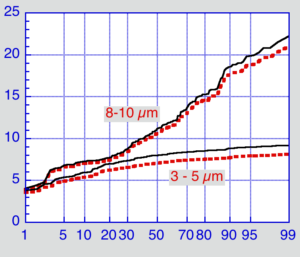
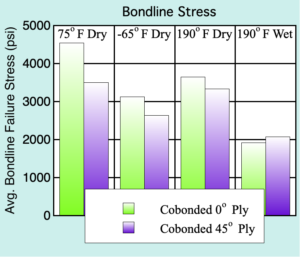
KaleidaGraph Graph Examples
Featuring over 25 different plot types. Mac and Windows data and plot files are fully interchangeable.


Meeting the needs of scientists and engineers for over 35 years.
See what one of our long-time customers has to say:
I started using KaleidaGraph about 30 years ago, as a much welcome upgrade to the venerable Cricket Graph, which I had used on an old MacPlus since 1986 - maybe started with KaleidaGraph when I got a Mac II with color monitor, although details not so clear as it was a long time ago. Since then I have introduced it to numerous PhD, Masters, and undergrad students, so have hopefully contributed somewhat to your growth. My first intervention was always to point out, when someone presented me with a horrible Excel 'chart', that it would really be much wiser to do such things with KaleidaGraph - nobody ever told me I was wrong about this! Best wishes for the future.